
If you are a trader, or just have an interest in the stock market, you probably already know what S&P 500 is. However, not many know the history of it. So, if you want to know more, read on.
What is S&P 500
The S&P 500 found its beginnings in 1957 when Standard & Poor’s decided to introduce a market index that will be used to track the value of the largest corporations that were listed on the NY Stock Exchange and the NASDAQ Composite. It represents the composition of the general economy. The exact combination and priorities of certain constituencies changes as it follows the economy. As the time passes, some stocks find their way onto the list, while others fall off.

A lot of people consider this index to be the most important indicator for the US economy. In essence, becoming the bellwether of it. Also, a lot of investors who aim for exposure to the US via index funds will use it. Ever since its beginnings, the performance of S&P 500 has been remarkable. It usually outpaces every other major asset class.
Stock Movement
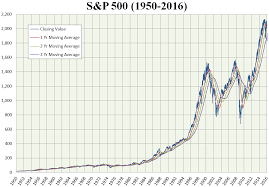
The steady increase in the price of S&P 500 always went hand-in-hand with the economic growth of the US. Looking into the price movements of S&P 500 will also give you an insight into turbulent periods. You can simply look for price swings. And, the long-term charts will allow you to check emotional highs of investors.
When this index opened in 1957, it was valued at 386.36. However, in the first decade, it came up all the way to 700. However, this was mostly due to the boom following the World War II. And, after that, it was on a steady decline. It took over two decades to rise back up to that level. In fact, from 1969 to 1981, it fell below 300. This period was also not very good for the economy in general. The growth was stagnant while the inflation was very high.
It took some time, but the Federal Reserve found success in reducing the pressure by early eighties. It was done through high interest rates. These rates were one of the bigger contributors to the rising market until the year 2000, when S&P 500 rose by 1,350%.The fact that the inflation rates went down meant that interest rates went down too. That, and other tailwinds helped the bull market a lot. This lead to billions of people all over the world experiencing globalization and entering the middle class.
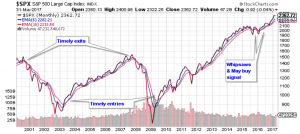
However, overvaluations, emotional decisions and enthusiasm of the public lead to a creation of a market bubble. Not to mention the amount of speculations regarding high-tech sector as the Internet became popular. As you can imagine, the bubble did burst during the early 2000s. And, while NASDAQ fell to almost only 10% of its value, the S&P 500 fell to 60%. It took it five years to recover and reach new heights. Thanks mostly to the new strength in financial stocks, housing, and commodity stocks.
Unfortunately, a lot of the gains fell back as the housing prices went down. This even lead to debt defaults and ripple effects in the entire financial system. At that time, the general public started avoiding the market in general. The S&P 500 fell to the new bottom by March 2009. However, the year 2009 was a brand new turning point for S&P 500. Much like in the early eighties, it has climbed. Right now, the S&P 500 is at a new all-time high as it rose over 250% since 2009.